Project 4: Twitch Streamer Live Recommedations
Why it matters?
One of the biggest concerns for any platform is figuring out how to make customers stay on their platforms. One way to do this is by recommending items that a user would like to retain user’s attention. The same goes with Twitch.
As a streaming platform, recommending streamers that users would enjoy could keep their interest and make them stay on the platform. However, live recommendation is different from traditional recommendation tasks. The first thing is dynamic availability. In traditional recommendation tasks, items are almost always available after they become available. However, in a live streaming platform, item (streamer) availability depends on when each streamer streams. Second, items are repeatedly consumed. For instance, in movie recommendations, it’s rarely the case that a user repeatedly watches already-watched movies. However, with this Twitch dataset, repeat consumptions are the majority of interactions. Thus, when approaching this problem, we need to consider these.
Overview
- Implemented Factorizing Personalized Markov Chains (FPMC) and FPMC_ext (borrowing location-based compatibility from Personalized Ranking Metric Embedding) in TensorFlow.
- Evaluated different models using Precision@K and Mean reciprocal rank and concluded the importance of recent interactions and geographical distance for recommending the next streamer to watch.
- Achieved Precision@10 of 0.659, which is about a 0.115 increase compared to the baseline.
- Link to Jupyter notebook
Data Collection
This dataset is collected by Jeremie Rappaz, Julian McAuley, and Karl Aberer using the Twitch API for their paper named Recommendation on Live-Streaming Platforms: Dynamic Availability and Repeat Consumption. The original dataset contains about 474.7 million interactions, which is the entire interaction in Twitch in July 2019 over a 43-day period with 10-minutue intervals. Because of a limitation on the computational power of my local device, I can’t compare different models quickly with the full dataset. Thus, as in the original paper, I used the dataset that randomly sampled 100k users for efficiency. The basic statistics of the two datasets are shown below.
| Bench | Full | |
|---|---|---|
| # Users | 100k | 15.5M |
| # Streamers | 162.6k | 465k |
| # Interactions | 3M | 474.7M |
| Watch time [h] | 800k | 124M |
The following are sample rows of the dataset.
| uid | sid | sname | start | end | |
|---|---|---|---|---|---|
| 0 | 1 | 33842865744 | mithrain | 154 | 156 |
| 1 | 1 | 33846768288 | alptv | 166 | 169 |
Visualizations
A few popular items
One of the characteristics of the Twitch interactions is that a few streamers dominate the interactions. As shown below, the ten most popular streamers are responsible for about 6.93% of the interactions. This percentage goes up to a little over 50% with 1,000 streamers. Considering 162,625 is the total number of streamers, 1,000 is a relatively small number.
| Num of streamers | % of interactions |
|---|---|
| 10 | 6.93% |
| 100 | 23.06% |
| 1,000 | 52.88% |
| 162,625 | 100% |
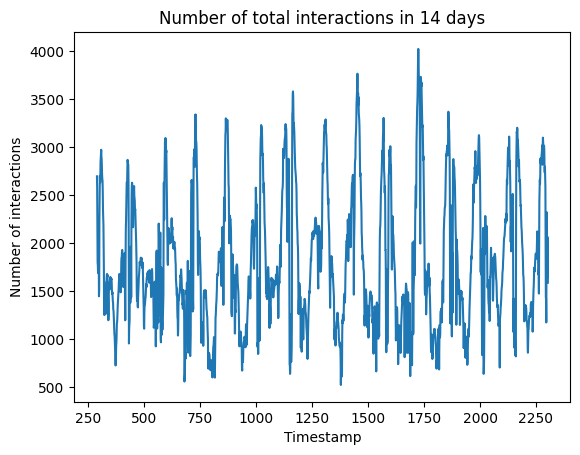
Number of total interactions in 14 days
Observation
- There is a clear daily pattern in the number of total interactions
- This is because Twitch is mostly used in the US [7] and the interactions are recorded without timezone. Thus, it’s likely that the periodicity is affected by the trend of US Twitch interactions.
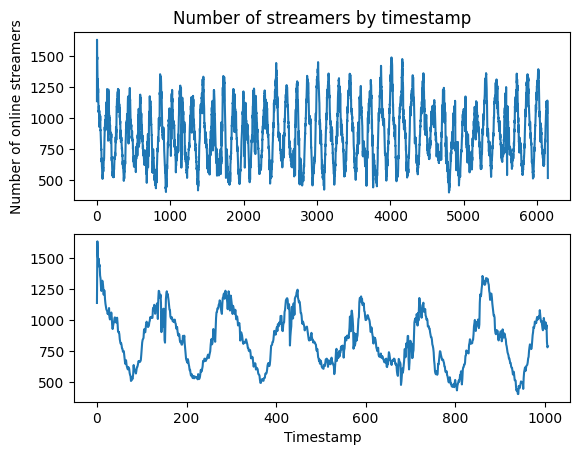
Number of streamers by timestamp
Observation
- The number of available streamers also shows a daily pattern
- This shows that not every streamer is available at an arbitrary point in time.
- Typically, there are about 500 to 1250 available streamers in each timestamp.
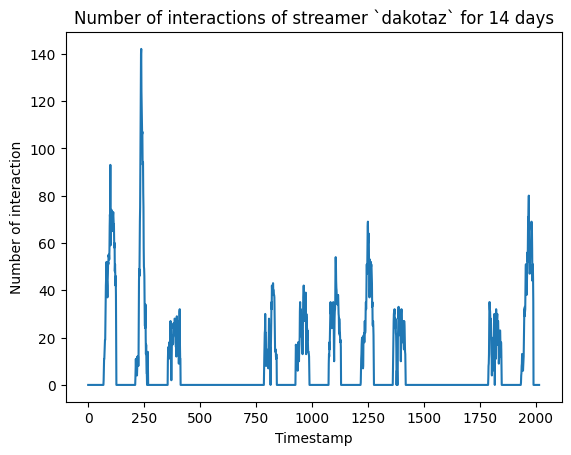
Number of interactions of a streamer for 14 days
Observation
- By looking at how the number of interactions changes over time for a streamer, we can state that a streamer is offline when there is no interaction. In other words, we should consider a streamer is available when there is at least one interaction in a certain timestamp.
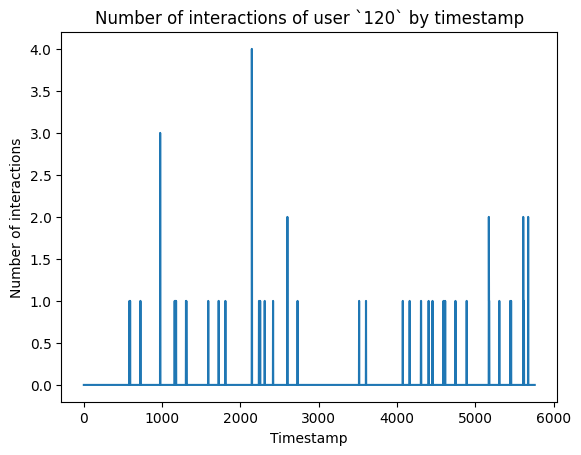
Number of interactions of user 120 by timestamp
Observation
- Typically, people would assume there will be one interaction for a user in one timestamp. However, as shown, there could be multiple interactions for a user in a single timestamp.
- About 6.46% of the total user interactions are interactions with more than 1 streamer in the same timestamp. For simplicity, I assumed users watch one stream at a time and disregard those 6.46%.
Pre-processing
Getting the most recent interaction
Considering a user’s watching behavior of how the most recent interaction affects what the user watches next, I added an extra column for each row that contains a previous streamer a user watched. When there isn’t one, I fill in with ‘dummy’.
For the test set, which is the very first interaction in the last 2 days window for each user, there are 699 interactions that do not have any previous interaction in the train set. Thus, I excluded those rows and left with 59,828 interactions.
Dynamic availability
To implicitly consider dynamic availability in the model, I randomly sampled from available streamers at a certain timestamp rather than from the full pool to get a negative interaction during training. This is the same method used in the paper by Jérémie [5].
Models
Ordering by counts
Considering the repeat consumption of this dataset, a decent baseline model could be solely based on counts of previous interactions and recommend items with an order of those counts. While this will work well with recommending what users mostly watch, it will fail to recommend new streamers users would like.
Matrix Factorization (MF)
Another baseline model can be the Matrix Factorization model which gives different values to different interactions between users and items to figure out the ordering of different items.
$$f(i|u) = \gamma_{u}^{(ui)}⋅\gamma_{i}^{(iu)}$$
When determining which item a user prefers, it follows the BPR-like framework as shown below with i’ indicating a negative item that a user did not interact with.
$$\sigma(f(i|u) - f(i’|u))$$
Factorizing Personalized Markov Chains (FPMC)
One of the models we can use for sequential data is FPMC which has the additional matrix for interaction between a previous and current item to figure out how likely it is to consume the current item based on the fact that a user interacted with the previous item.
$$f(i|u,j) = \gamma_{u}^{(ui)}⋅\gamma_{i}^{(iu)}+\gamma_{i}^{(ij)}⋅\gamma_{j}^{(ji)}$$
Similarly, the loss is determined by the following with the additional term j which indicates a previous item.
$$\sigma(f(i|u,j) - f(i’|u,j))$$
FPMC_ext
Combining FPMC with Personalized Ranking Metric Embedding (PRME)
Another model we can use is PRME, which is essentially the same as FPMC except that it uses the Euclidean distance instead of the product between gamma values for the interaction between the previous and current item. The idea behind this change is that neighboring items in sequential data are likely to be similar instead of one being an extreme of the other.
$$f(i|u,j) = -||\gamma_{u}^{(ui)} - \gamma_{i}^{(iu)}||-||\gamma_{i}^{(ij)} - \gamma_{j}^{(ji)}||$$
So I borrowed the use of Euclidean distance for capturing the compatibility between current and previous items. The mix of dot product and Euclidean distance would allow the model to capture user’s preference strength and direction and consider location-based compatibility between previous and current item for better personalized recommendation.
$$f(i|u,j) = \gamma_{u}^{(ui)}⋅\gamma_{i}^{(iu)}-||\gamma_{i}^{(ij)} - \gamma_{j}^{(ji)}||$$
Prediction
For the first baseline, which is about counting previous interactions for ordering, it is easily done with pandas functions. For MF, FPMC, and FPMC_ext., I used the code from Personalized Machine Learning as a baseline with several modifications such as incorporating dynamic availability in negative sampling and using the Euclidean distance instead of product depending on the model [4].
The training was done in CPU with early stopping when there wasn’t an improvement in loss in 30 steps.
The following table shows the evaluation metric scores for all 4 models. Since this dataset is mostly about repeat consumption but we are also interested in recommending new streamers for users, I separated the precision@k score into old, new, and all.
| Baseline 1 | MF | FPMC | FPMC_ext | |
|---|---|---|---|---|
| Precision@1_old | 0.313 | 0.168 | 0.209 | 0.302 |
| Precision@6_old | 0.726 | 0.484 | 0.592 | 0.684 |
| Precision@10_old | 0.847 | 0.59 | 0.678 | 0.763 |
| Precision@1_new | 0.0 | 0.042 | 0.067 | 0.089 |
| Precision@6_new | 0.0 | 0.193 | 0.268 | 0.377 |
| Precision@10_new | 0.0 | 0.257 | 0.349 | 0.472 |
| Precision@1_all | 0.201 | 0.123 | 0.158 | 0.226 |
| Precision@6_all | 0.466 | 0.38 | 0.476 | 0.574 |
| Precision@10_all | 0.544 | 0.471 | 0.56 | 0.659 |
| Mean reciprocal rank | 0.481 | 0.231 | 0.287 | 0.367 |
Interpretation
As you can see from the result table, the baseline model actually does the best job of recommending repeat (old) consumption compared to all other models. This is primarily because the majority of interactions are repeat consumption. Due to this, the baseline also has a better score in precision@k_all than the MF model.
One of the biggest problems with this baseline is that it can never recommend new streamers, which is why the precision scores for new are all 0. Thus, it’s simply showing users their histories rather than recommending them, and the ordering will hardly ever change due to how histories stack unless it gets cleared every 1 or 2 weeks. To solve this problem, we should consider other models.
With the MF, FPMC, and FPMC_ext models, you can see how they perform much better in recommending new items compared to the baseline model. From the result, models that include the user’s previous interaction (FPMC and FPMC_ext) perform better. This shows that it’s important to consider the latest user interaction to recommend what a user would watch next. Another thing to take note of is the superior results from FPMC_ext. This shows that recommending Twitch streamers works best with the geographical distance between streamers.
Considering Twitch user watch behavior, the reason why FPMC_ext works the best makes sense. For instance, when user A recently got into streamer Z, it’s likely that user A would watch streamer Z next even though streamer Y shows up the most in the user’s history. And when user A previously watched a streamer playing a game with some violence, it doesn’t mean the user is going to watch a streamer who plays the most violent game. Instead, the user is likely going to stick around with streamers who play games with a similar amount of violence.
Conclusion
With the result, we can take away 4 things.
- Considering dynamic availability is critical in Twitch live streaming recommendation
- Simply using the baseline will not get you any further than what users already interacted with but gives you the best score for recommending repeat interactions
- The most recent interaction is critical in recommending which streamers users would watch next.
- Using the Euclidean distance works better, which could be explained by users watching behavior.
Reference
[1] Benson, Austin R., et al. “Modeling user consumption sequences.” Proceedings of the 25th International Conference on World Wide Web, 2016, https://doi.org/10.1145/2872427.2883024.
[2] Chen, Edgar, et al. “Weighing Dynamic Availability and Consumption for Twitch Recommendations.” Proceedings of The 2nd International Workshop on Online and Adaptive Recommender Systems, 2022, https://assets.amazon.science/cf/c6/8f4bd3f9493a9996aebb70d8b6e4/weighing-dynamic-availability-and-consumption-for-twitch-recommendations.pdf
[3] Kaytoue, Mehdi, et al. “Watch me playing, I am a professional.” Proceedings of the 21st International Conference on World Wide Web, 2012, https://doi.org/10.1145/2187980.2188259.
[4] McAuley, Julian. “Autoregression.” Chapter 7, cseweb.ucsd.edu/~jmcauley/pml/code/chap7.html. Accessed 15 Dec. 2023.
[5] Rappaz, Jérémie, Julian McAuley and Karl Aberer. “Recommendation on live-streaming platforms: Dynamic Availability and repeat consumption.” Fifteenth ACM Conference on Recommender Systems, 2021, https://doi.org/10.1145/3460231.3474267.
[6] Tsukuda, Kosetsu, and Masataka Goto. “Explainable recommendation for repeat consumption.” Fourteenth ACM Conference on Recommender Systems, 2020, https://doi.org/10.1145/3383313.3412230.
[7] “World Population Review.” Twitch Users by Country 2023, worldpopulationreview.com/country-rankings/twitch-users-by-country. Accessed 15 Dec. 2023.